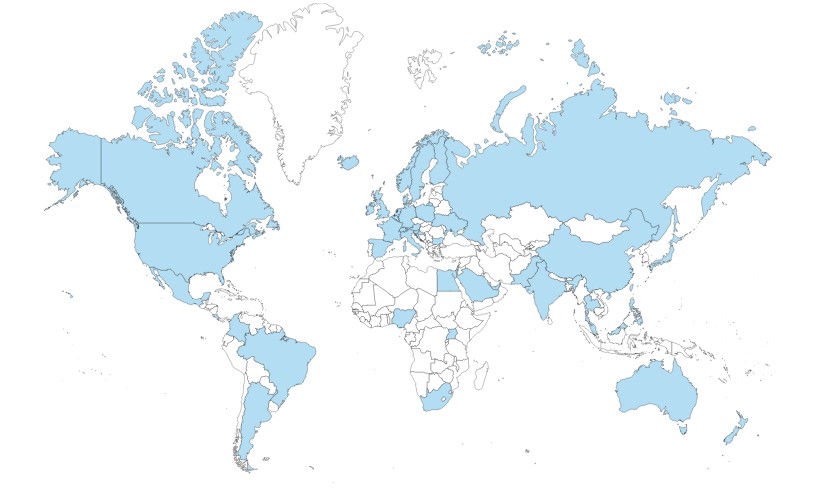
The following table summarizes the Chicon 8 membership international demographics as of August 18, 2022. We’re pleased to welcome our first members from Argentina, Croatia, Egypt, and Pakistan, meaning that we now have members from an amazing 51 countries! This makes us one of the most truly international Worldcons of all time.
| Country | Adult Attending* |
Age Attending** |
Virtual | Supporting | Total |
| Argentina | 1 | 1 | |||
| Arrakis | 1 | 1 | |||
| Australia | 13 | 15 | 77 | 105 | |
| Austria | 1 | 5 | 6 | ||
| Bahamas | 1 | 1 | |||
| Belgium | 5 | 4 | 9 | ||
| Bermuda | 1 | 1 | |||
| Brazil | 1 | 3 | 1 | 5 | |
| Bulgaria | 2 | 2 | |||
| Canada | 84 | 4 | 14 | 149 | 251 |
| China | 7 | 1 | 22 | 30 | |
| Colombia | 1 | 1 | |||
| Costa Rica | 1 | 1 | |||
| Denmark | 1 | 3 | 4 | ||
| Egypt | 1 | 1 | |||
| Finland | 5 | 7 | 27 | 39 | |
| France | 4 | 7 | 11 | ||
| Germany | 13 | 3 | 6 | 43 | 65 |
| Hain | 2 | 2 | |||
| High Hallack | 6 | 6 | |||
| Hong Kong | 1 | 1 | |||
| Iceland | 3 | 1 | 4 | ||
| India | 1 | 2 | 3 | ||
| Ireland | 9 | 9 | 14 | 32 | |
| Israel | 2 | 1 | 4 | 7 | |
| Italy | 2 | 9 | 11 | ||
| Japan | 10 | 4 | 3 | 17 | |
| Luxembourg | 1 | 1 | 2 | ||
| Magrathea | 5 | 5 | |||
| Malaysia | 1 | 1 | 2 | ||
| Mexico | 2 | 2 | |||
| Netherlands | 5 | 2 | 13 | 20 | |
| New Zealand | 8 | 5 | 11 | 24 | |
| Nigeria | 1 | 1 | 1 | 3 | |
| Norway | 1 | 3 | 4 | 8 | |
| Pakistan | 1 | 1 | |||
| Pern | 3 | 3 | |||
| Philippines | 1 | 1 | |||
| Poland | 2 | 2 | 3 | 7 | |
| Qatar | 1 | 1 | |||
| Russia | 1 | 1 | |||
| Saudi Arabia | 1 | 13 | 14 | ||
| The Shire | 4 | 4 | |||
| Singapore | 1 | 1 | |||
| Slovenia | 1 | 1 | |||
| South Africa | 1 | 1 | 2 | ||
| Spain | 1 | 1 | 12 | 14 | |
| Sweden | 11 | 2 | 4 | 15 | 32 |
| Switzerland | 2 | 1 | 7 | 10 | |
| Taiwan | 1 | 1 | |||
| Thailand | 1 | 1 | |||
| Uganda | 19 | 19 | |||
| Ukraine | 4 | 4 | |||
| United Arab Emirates | 1 | 1 | |||
| United Kingdom | 67 | 7 | 37 | 133 | 244 |
| United States | 3,006 | 174 | 214 | 1,091 | 4,485 |
| Total | 3,291 | 190 | 346 | 1,684 | 5,511 |
** Includes Young Adults, Teen, an d Child Attending members.
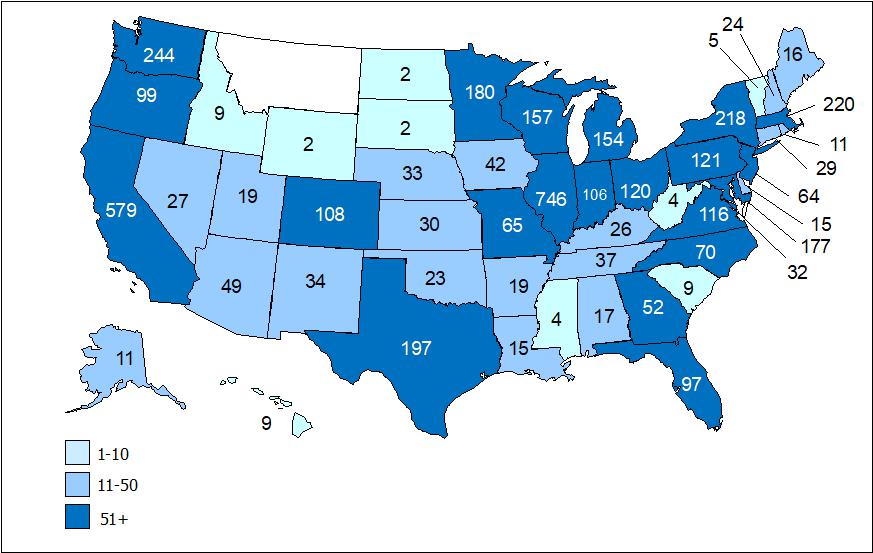
The US state demographics for the 4,485 US members are shown on the following map and table. We are delighted to have members registered from 49 out of the 50 states (plus Washington, D.C., Guam, and US forces overseas).
| Alabama (17) | Hawaii (9) | Missouri (65) | Rhode Island (11) |
| Alaska (11) | Idaho (9) | Montana (0) | South Carolina (8) |
| Arizona (49) | Illinois (746) | Nebraska (33) | South Dakota (2) |
| Arkansas (19) | Indiana (106) | Nevada (27) | Tennessee (37) |
| Armed Forces Europe (1) | Iowa (42) | New Hampshire (24) | Texas (197) |
| Armed Forces Pacific (1) | Kansas (30) | New Jersey (64) | Utah (19) |
| California (579) | Kentucky (26) | New Mexico (34) | Vermont (5) |
| Colorado (108) | Louisiana (15) | New York (218) | Virginia (116) |
| Connecticut (29) | Maine (16) | North Carolina (70) | Washington (244) |
| Delaware (15) | Maryland (177) | North Dakota (2) | West Virginia (4) |
| D.C. (32) | Massachusetts (220) | Ohio (120) | Wisconsin (157) |
| Florida (97) | Michigan (154) | Oklahoma (23) | Wyoming (2) |
| Georgia (52) | Minnesota (180) | Oregon (99) | Unknown (37) |
| Guam (1) | Mississippi (4) | Pennsylvania (121) |